I installed iftop with opkg but can’t reconcile the data flows with what I’m seeing on the clients, under task manager or elsewhere. iftop is reporting much lower traffic by an order of magnitude.
I am on fw 3.208.
Do you have any suggestions on how I can see data traffic destinations and volumes?
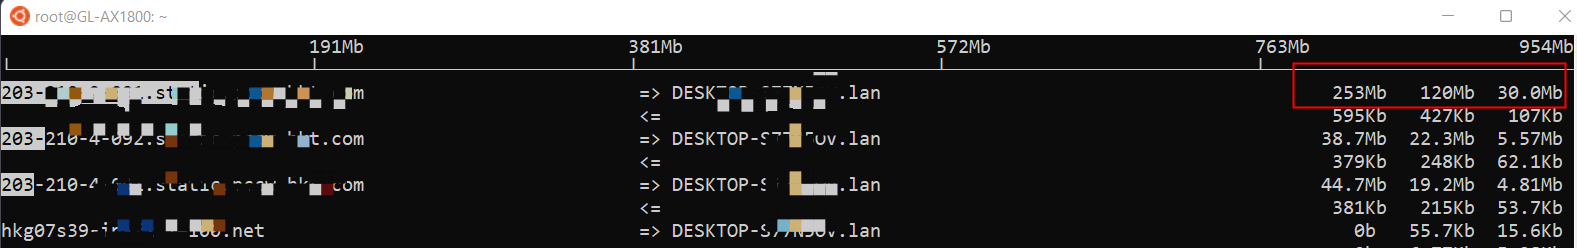
The main part of the display lists, for each pair of hosts, the rate at which data has been sent and received over the preceding 2, 10 and 40 second intervals. The direction of data flow is indicated by arrows, <= and =>. For instance,