I have a Spitz and a Puli. I see per client it will show current up/download bandwidth usage. Is there anywhere to get global usage for the wan/lan. If not could it be added to the system page maybe like the CPU usage and memory usage graph. Or on top of clients page. Most asus routers have this feature on the app and its handy to see total pull on the WAN/LTE
1 Like
We have seen a lot of similar requirements.
The only problem is that there is a large deviation between the traffic recorded by the device as forwarded to the WAN side and the Internet traffic recorded by the carrier. For interfaces that use traffic billing, this can be misleading to users.
1 Like
What if its just current draw and up to last minute so it cant be used to check against billing but could still check load on the system.
Like a 0 to 60 seconds live usage
1 Like
Good idea, we’ll discuss it.
1 Like
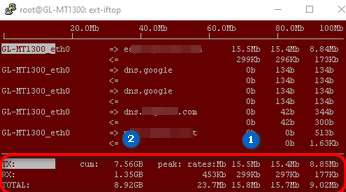
I do use iftop on the CLI to see detailled and overall traffic stats (puTTY via SSH).
(1) is the current traffic (the length of the white bar represents it as well), (2) is the total traffic since you started iftop.
Tell me if that was an option for you and you need a HowTo.
To monitor global usage for WAN/LAN on your network, you can use broadband traffic bandwidth monitor tools that provide comprehensive insights. Here are a few options:
- ManageEngine OpManager: Offers detailed network performance monitoring, including WAN/LAN usage.
- Paessler PRTG Network Monitor: Monitors bandwidth usage and provides real-time data on network traffic.
- Site24x7: A cloud-based service that tracks network performance and usage.
These tools can help you visualize total bandwidth usage similar to CPU and memory usage graphs.