Brume 3 - Data Statistics looks completely broken

Hello @will.qiu

Any chance you’re close to a fix? It’s taking much longer than what I’ve seen from just about any other vendor I’ve used in the past few decades.

I’ve been running 4.9.0 Beta2 2026-06-10 for a few days now.

The timezone has beenswitched, as per your recommendation, to Etc/GMT+4.

Yet, even the single day view now is wrong, showing all the data in the 10pm slot of one day, repeated in the 12am slot the next day, see below.

Hi

We are currently testing a potential solution. Once it has been verified, we will try to include the fix in the next firmware release.

If you would like to test it in advance, you can try the following steps:

  1. Disable the Data Statistics feature.

  2. SSH into the router and modify the /etc/monitor_traffic.lua script as shown below:

  3. After that, change the timezone back to America/Toronto.

  4. Re-enable Data Statistics, then click the broom icon to clear the historical data and avoid any interference from existing records.

1 Like

root@GL-MT5000:~# grep -n localtime /etc/monitor_traffic.lua
324: strftime('%Y-%m-%d', log_time_end, 'unixepoch', 'localtime') as log_date,
336: strftime('%Y-%m-%d', log_time_end, 'unixepoch', 'localtime')

I’m back to America/Toronto tz and wiped the data.

I’ll report back in 24-48hrs.

1 Like

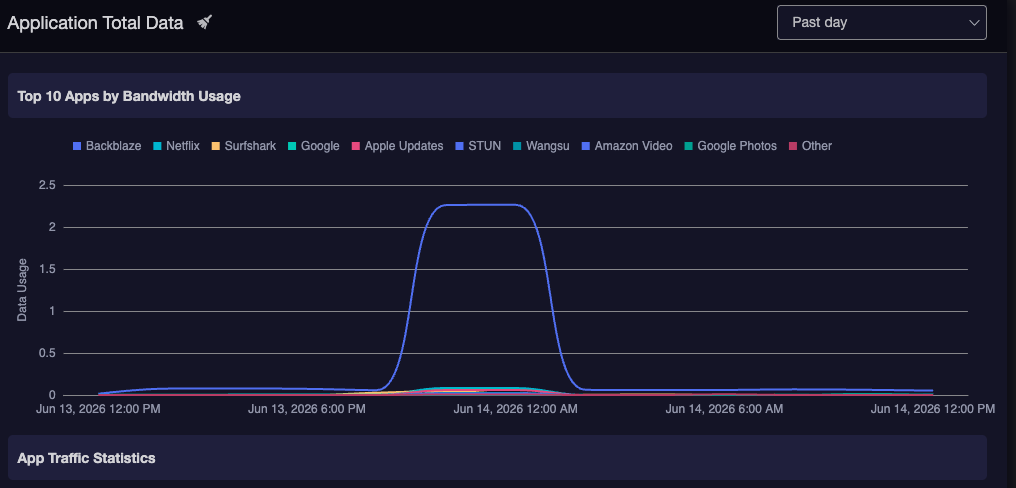
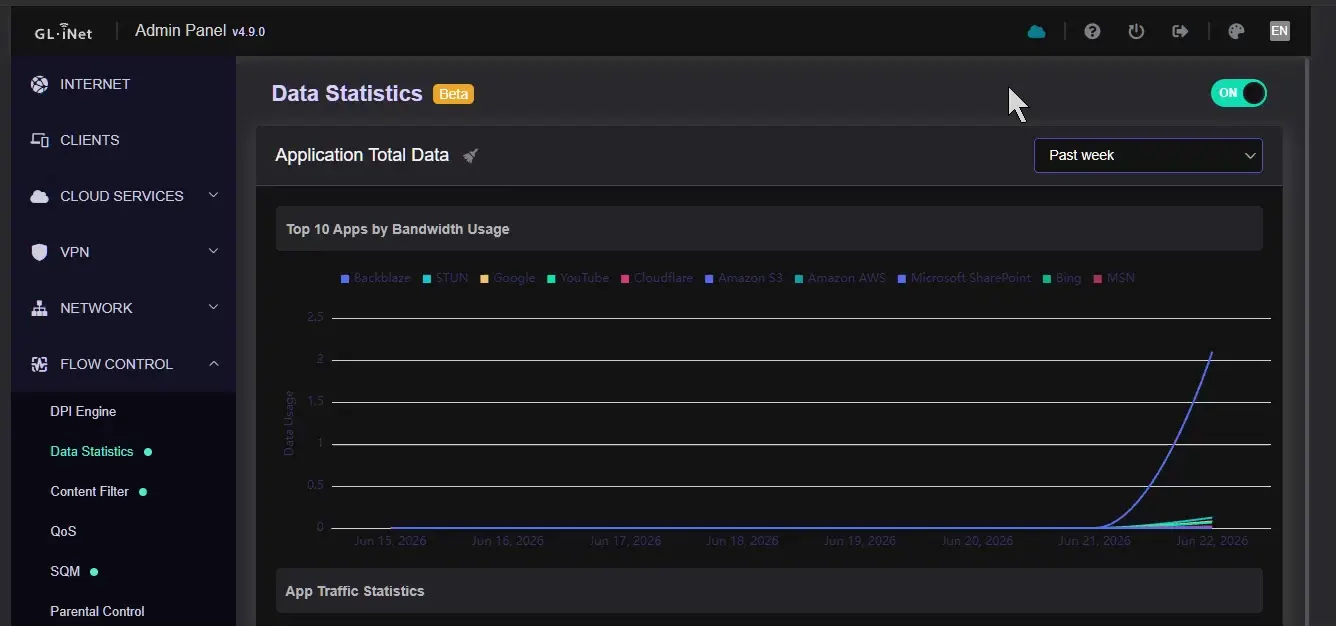
@will.qiu I’m afraid the data is still displayed all lumped up at same 10:00pm and 12:00am hump in the Past Day view; and all rolled up in the current day in the Past Week view.

Hi

That seems a bit unusual.

In our local testing, the workaround functioned correctly after modifying the Lua script:

mt5000_v4.9.0beta_dpi-issue690x431

Before making the modification, did you disable the Data Statistics feature?

If not, the Lua script may not have been reloaded, which could explain why the issue persists.

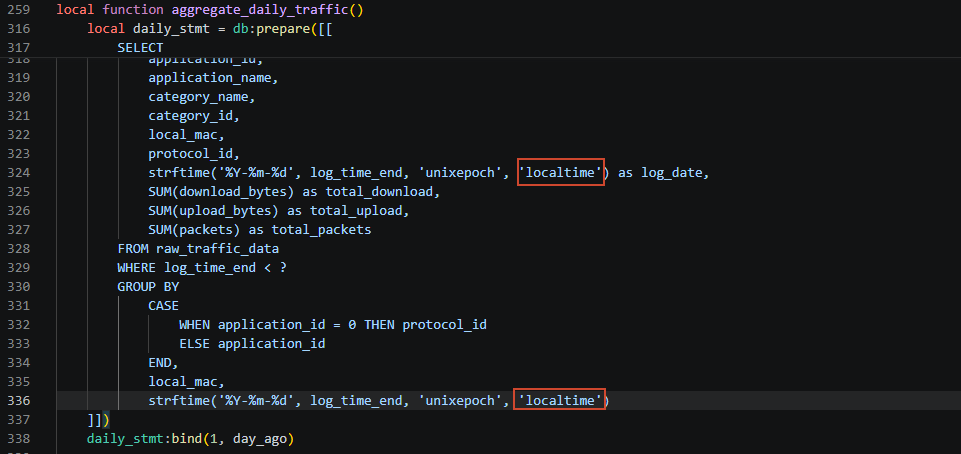
I believe I followed the 4 steps correctly and did Disable first, and Enable after I modified the LUA script.

Should I try one more time to just Disable, Enable, Clear and see if that changes anything?

Your video shows very little data and I wonder if that could be the issue. To do a test similar to mine, you can open a Trial account with Backblaze, and install the backup client on a machine with lots of data/storage/files/HDDs/etc. Let it backup with default settings for a few days (trial is 14 days, no limit) and you should see at least 4-5TB/day uploaded to their cloud service. Maybe the way you handle the volume of data in your database is too much for the Brume 3?

@will.qiu Here’s what I get when I redid the steps on 23rd around 1800ET

Screen Recording 2026-06-23 180423

…and today, 25th at just after noon ET

Screen Recording 2026-06-25 124035

Loop at the “blip” at 10pm and midnight.

Hi

So, from what we can see, the previous issue where the usage data lumped up in the past day appears to have been fixed.

The new issue is that the data for the 22:00 / 24:00 period is incorrect.

Is our understanding correct?

If so, could you please follow the same procedure as before, but replace the contents of /etc/monitor_traffic.lua with the attached file and test again?

monitor_traffic.lua.txt (14.3 KB)

ll /etc/monitor_traffic.lua
cp monitor_traffic.lua.txt /etc/monitor_traffic.lua
chmod 775 /etc/monitor_traffic.lua
ll /etc/monitor_traffic.lua

(Please make sure the file permissions are the same before and after the replacement.)