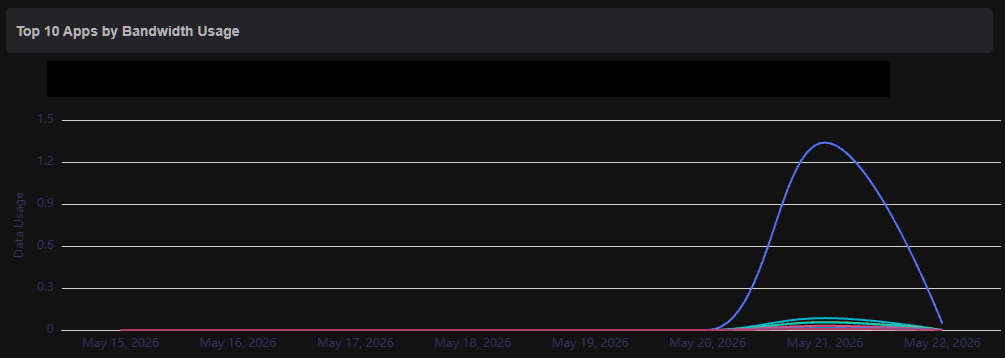
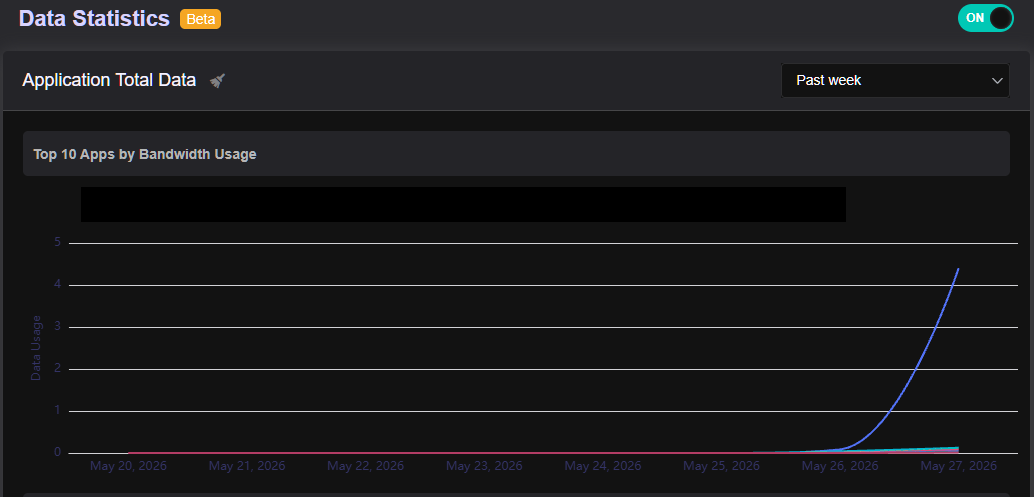
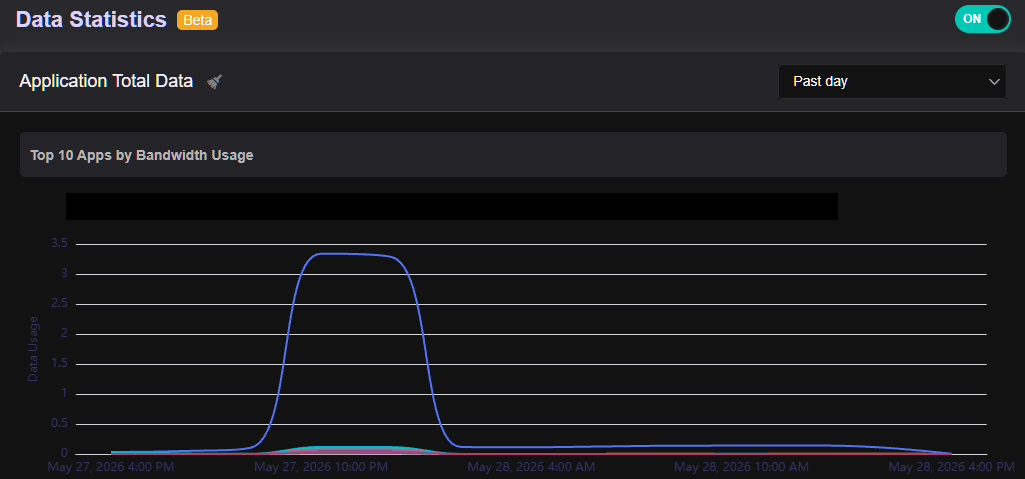
Hi folks, I’ve been trying to get some idea on “Apps by Bandwidth Usage” under Data Statistics but while the Past Day view might be somewhat reasonable, the Past Week view seems to be completely broken showing no traffic whatsoever, apart fom the traffic in the past day.
There is only 4.6.8 that I can find and not many hits on the one device that I just purchased with DPI being fully supported, and I’d assumed, fullu tested and passed QA.
Happy to send you logs, traces, whatever you need to see why week and day views are showing all data rolled up in the last 24 hours. What’s the flow of that data, where is it supposed to be stored?
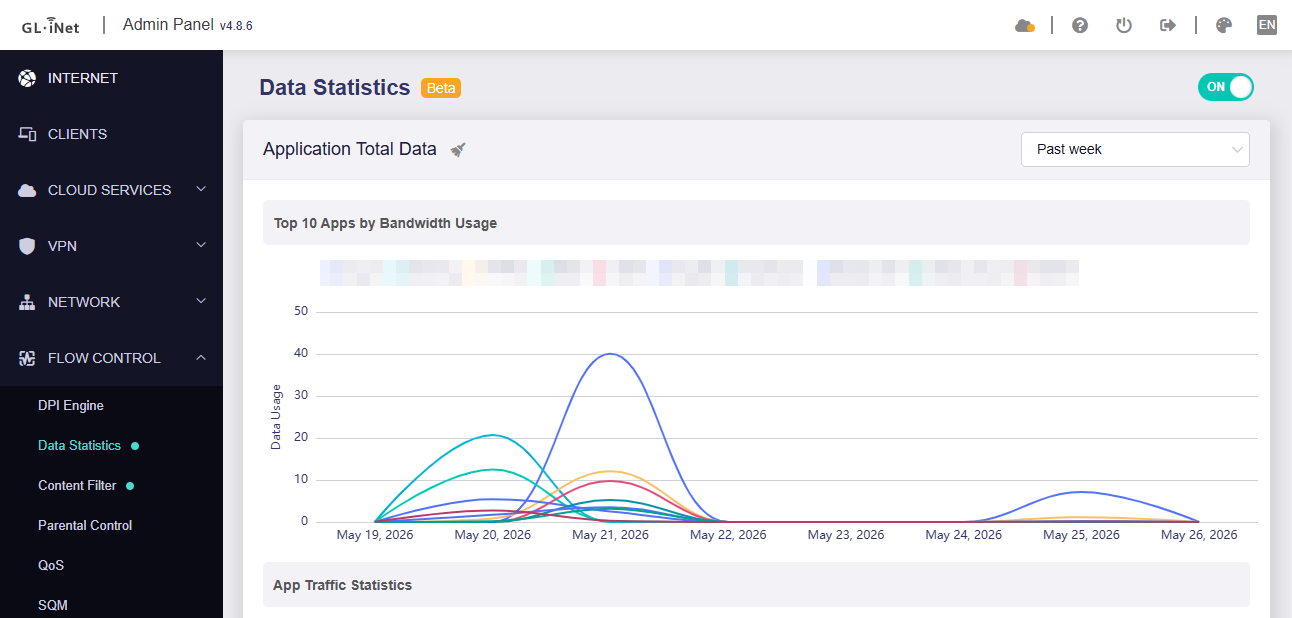
I toggled off (rebooted) and back on the Data Statistics. Let’s give it a day or two and see of all traffic would still be bundled into a single day or something was stuck and this fixed it as I already see some traffic from 20th and some from today, 21st (if this is all in EDT)
@will.qiu - any troubleshooting steps? are you able to reproduce in your environments?
I see several other posts on this bug and although the other OPs aren’t running the DPI enging on an “officially supported at the time of purchase” hardware, the DPI engine is probably the same, or very similar.
We recommend SSHing into the router and running the following commands to check:
Check whether the router’s current time is accurate:
logread | grep timesync
date
Check the timezone configuration:
uci show system.@system[0].zonename
uci show system.@system[0].timezone
Check the database contents to see whether the data belongs to previous dates:
# Move WAL file transactions back into the database
sqlite3 /tmp/traffic_data.db "PRAGMA wal_checkpoint(FULL);"

# Show database contents and convert Unix timestamps to local time
sqlite3 -header -column /tmp/traffic_data.db "
SELECT
  id,
  datetime(log_time_start, 'unixepoch', 'localtime') AS start_time,
  datetime(log_time_end, 'unixepoch', 'localtime') AS end_time,
  application_id,
  application_name,
  download_bytes,
  upload_bytes,
  packets,
  local_ip,
  local_mac,
  protocol_id,
  datetime(timestamp, 'unixepoch', 'localtime') AS time,
  category_name,
  category_id
FROM raw_traffic_data
ORDER BY timestamp ASC
"
We tested using the Brume 3 with firmware v4.8.6, but were unable to reproduce the issue:
Thanks for the debugging steps and for confirming it all works fine in your environment.
1.I don’t see timesync in the log.
root@GL-MT5000:~# logread | grep timesync
root@GL-MT5000:~# date
Tue May 26 13:10:21 EDT 2026
root@GL-MT5000:~# uci show system.@system[0].zonename
system.cfg01e48a.zonename='America/Toronto'
root@GL-MT5000:~# uci show system.@system[0].timezone
system.cfg01e48a.timezone='EST5EDT,M3.2.0,M11.1.0'
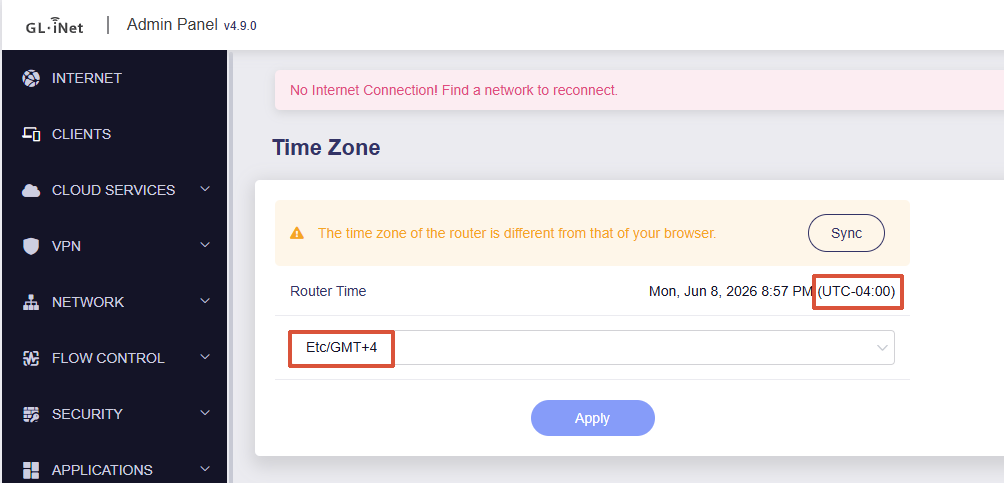
It feels like timezone/UTC offset mismatch bug inside the daily database aggregation script.
This match to UTC makes me wonder if it misinterprets the my EDT timestamps, dropping the historical blocks instead of archiving them into the weekly/monthly view tables.
Are you able to check how the database rotation script handles local vs. UTC time gaps on firmware v4.8.6 using a device setup for Toronto EDT?
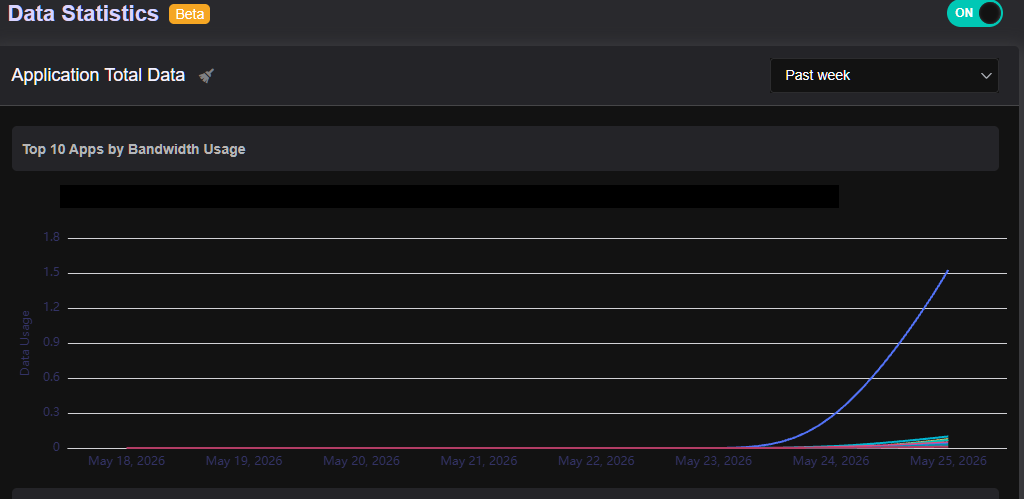
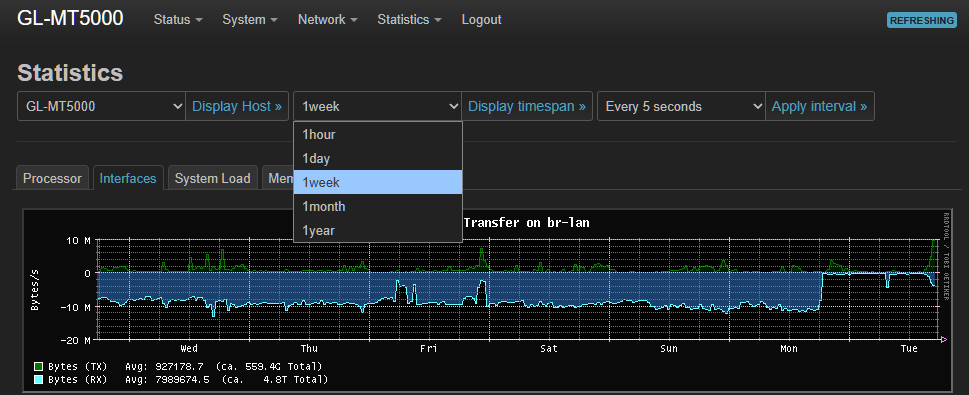
The bug is consistent, here’s today’s view, appears to have the same cut-off bug and most of the data we say yesterday under May 25th is truncated/lost in the May 26th view below.
root@GL-MT5000:~# ps | grep -E 'tertf|gl-dpi|traffic'
13649 root      6340 S    /usr/bin/eco /usr/bin/gl-dpi
28937 root      9548 S    eco /etc/monitor_traffic.lua
To see if I could force a manual synchronization, I targeted and cycled the daemon directly via its PID (kill 13649). The process safely terminated and immediately respawned under a fresh PID, confirming the orchestration layer is alive.
However, checking the file sizes right after shows that the sync did not happen:
The core engine is fine: The RAM database (/tmp) is actively growing (now at 33.1 MB), meaning traffic is being intercepted and parsed successfully.
The sync interval is broken? The persistent flash file (/etc) has is still frozen at 27.3 MB since 15:18. Even a process restart doesn't force a flush.
Because the system is missing its steady hourly progression checkpoints on the disk, the frontend UI ends up squishing a massive lump-sum data dump into a single, vertical cliff-like spike on the "Past Day" chart layout instead of distributing it smoothly across a 24-hour timeline.
root@GL-MT5000:~# sqlite3 /etc/netifyd/traffic_data.db "PRAGMA integrity_check;" ok
Perhaps a bug with how the eco engine/Lua tasks handle the disk write-back timers?
This program comes with ABSOLUTELY NO WARRANTY.
Netifyd is dual-licensed under commercial and open source licenses. The
commercial license gives you the full rights to create and distribute software
on your own terms without any open source license obligations.
Netifyd is also available under GPL and LGPL open source licenses. The open
source licensing is ideal for student/academic purposes, hobby projects,
internal research project, or other projects where all open source license
obligations can be met.
You appear to be using some of the netify open source but mixing it with your own gl-dpi enging, and the syncing is done in the closed source part. Anything in the monitor_traffic.lua maybe?
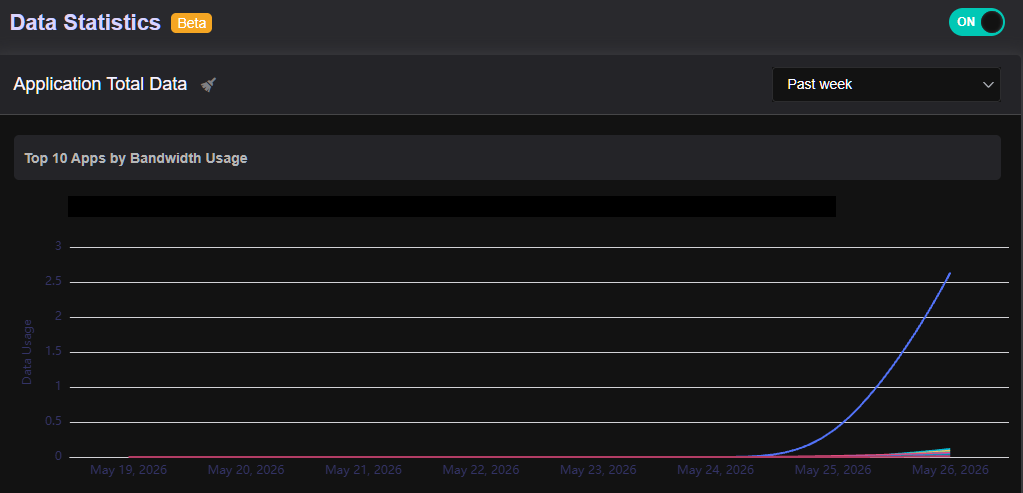
@will.qiu sorry for the bits and pieces of updates. this view clearly shows that the data is being lumped together. I don’t have the bandwidth to do that much in just a couple of hours, then go to sleep. it’s a backup that pushes up data fairly consistently 24x7