Similarly strange, this is on 4.6.4-op24.
iperf3 from the Flint 2 to internet (4Gbit symmetrical, so given the ethernet ports on the Flint 2, the upper bound is 2.5Gbit/s):
# iperf3 -c speedtest.ams1.nl.leaseweb.net -p 5201-5210
Connecting to host speedtest.ams1.nl.leaseweb.net, port 5201
[...]
[ ID] Interval           Transfer     Bitrate         Retr
[  5]   0.00-10.00  sec  2.01 GBytes  1.73 Gbits/sec    3             sender
[  5]   0.00-10.05  sec  2.01 GBytes  1.72 Gbits/sec                  receiver

# iperf3 -c speedtest.ams1.nl.leaseweb.net -p 5201-5210 -R
Connecting to host speedtest.ams1.nl.leaseweb.net, port 5201
Reverse mode, remote host speedtest.ams1.nl.leaseweb.net is sending
[...]
[ ID] Interval           Transfer     Bitrate         Retr
[  5]   0.00-10.05  sec  1.41 GBytes  1.21 Gbits/sec    0             sender
[  5]   0.00-10.00  sec  1.39 GBytes  1.20 Gbits/sec                  receiver
iperf3 from my Mac, going through the Flint 2 as the router (over ethernet, as @WizMeister already said, the WiFi speed was a red herring):
% iperf3 -c speedtest.ams1.nl.leaseweb.net -p 5201-5210
Connecting to host speedtest.ams1.nl.leaseweb.net, port 5201
[...]
[  7]   0.00-10.01  sec  2.63 GBytes  2.26 Gbits/sec                  sender
[  7]   0.00-10.01  sec  2.63 GBytes  2.25 Gbits/sec                  receiver

~ % iperf3 -c speedtest.ams1.nl.leaseweb.net -p 5201-5210 -R
Connecting to host speedtest.ams1.nl.leaseweb.net, port 5201
Reverse mode, remote host speedtest.ams1.nl.leaseweb.net is sending
[...]
[ ID] Interval           Transfer     Bitrate         Retr
[  7]   0.00-10.01  sec  2.69 GBytes  2.31 Gbits/sec    0             sender
[  7]   0.00-10.00  sec  2.67 GBytes  2.29 Gbits/sec                  receiver
So, the Flint 2 is perfectly capable of routing close to 2.5Gbit (this is even over PPPoE with VLAN tagging), however performs worse when running iperf on the Flint 2 itself. This is not a huge issue of course, since we usually generate traffic from clients, but curious nonetheless.
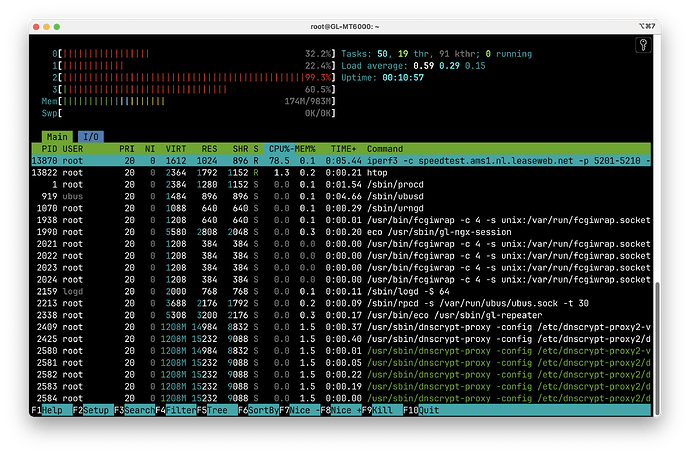
Like I said upthread, I think this caused by something becoming CPU-bound. See the htop screenshot below made while running iperf. You can see iperf using roughly 80% CPU, but the load is much higher than just that iperf process. Also, all the bars are red, meaning that the time is spent in kernel threads. So I am still wondering if running iperf on the device itself somehow triggers a (routing?) path that is not hardware-accelerated.
