Firmware: 4.8.1 (stable) Issue: procd memory leak during high network activity (online gaming)
When playing online games (Overwatch, 2 devices simultaneously), procd grows from ~2KB to 493MB within 2 hours, eventually exhausting all RAM and swap, causing OOM kills and network disconnection.
Evidence from memory monitoring (1-minute intervals):
Time
Activity
procd VSZ
11:13
Idle
2.3 KB
11:30
Gaming
28 MB
12:00
Gaming
118 MB
12:53
Gaming
283 MB
13:00
Stop gaming
308 MB (stable, not released)
17:30
Idle 5 hours
308 MB (never released)
18:30
Gaming again
380 MB
18:57
Gaming
479 MB
19:01
Swap exhausted
493 MB (OOM)
Key observations:
Memory only grows during gaming (high UDP traffic), stable during idle
Leaked memory is never released until reboot
Disabled all VPN-related hotplug scripts (WireGuard, OpenVPN, Tailscale, Tor) - no improvement
Network Acceleration disabled
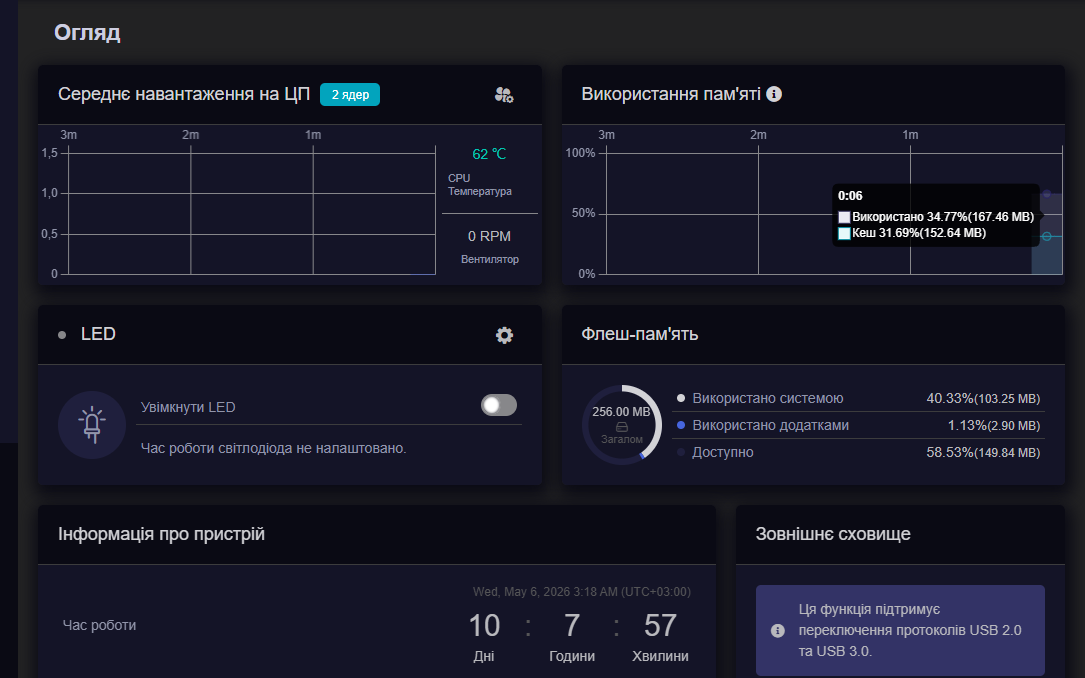
ZRam configured at 256MB with zstd - only delays the crash
Workaround: Daily scheduled reboot at 5 AM
Request: Could you check if this is a known issue with procd on MT7981/MTK SDK? Is it fixed in 4.8.3-op24?
I have firmware version 4.8.3-op24 installed on my GL-MT3000; I’ve been using it since it was released and haven’t had any issues, even during long online gaming sessions.
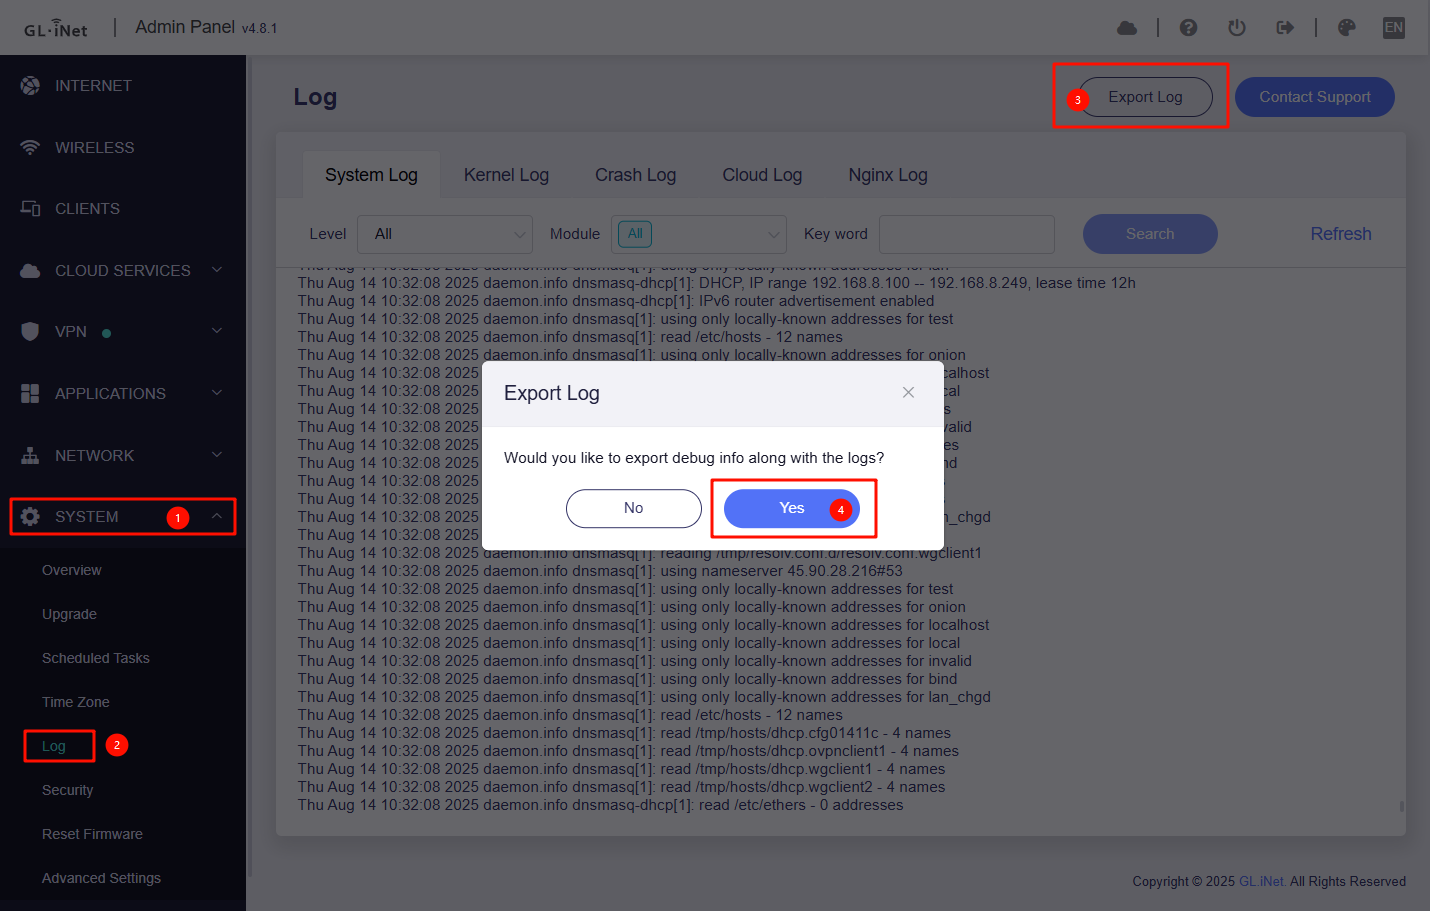
Export the device logs and send them to us via private message for analysis
Based on your description, it seems that memory usage does not continue increasing after stopping the game. So, could you please follow the guide and share your device with us via GoodCloud when the memory usage has increased significantly but before an OOM occurs, so we can check it remotely? Technical Support via GoodCloud - GL.iNet Router Docs 4
Kindly note to send us the MAC address and the router password via private message so we can access it.
Thank you! I just saw your reply. I will do taht when same problem happend again (honestly it already happened many time but let me try to catch the log next time
Unfortunately, after checking them, we were unable to find any useful clues.
Currently, we can confirm the following:
An OOM (Out Of Memory) event did occur, and nginx was repeatedly stopped to help release memory.
However, nginx only consumed around 10.5 MB RSS, so it is unlikely to be the root cause.
The OOM information in the logs is incomplete. The 56 visible processes only account for around 18.4 MB RSS + 4.6 MB swap, so we cannot currently identify which process consumed excessive memory and triggered the OOM.
Could you please help us with the following?
Please run the following commands via SSH to store logs on the Flash memory. This way, if the issue occurs and the device needs to be rebooted, the logs will not be lost and can be exported and sent to us for analysis.
If possible, please open an additional terminal window and run the following script in the background. This will allow us to monitor memory usage in real time and collect relevant information after the issue occurs for further analysis: