Is there any way to quickly view a list of important events that have occurred on the GL-X3000? By important events, I mean stuff like:
User/Admin authenticated/accessed device via management service X (eg. SSH, web, etc.)
Device has booted/rebooted
WAN x is down
WAN x is up
Device is offline (all WANs are down)
Device is online (one or more WANs are up)
etc.
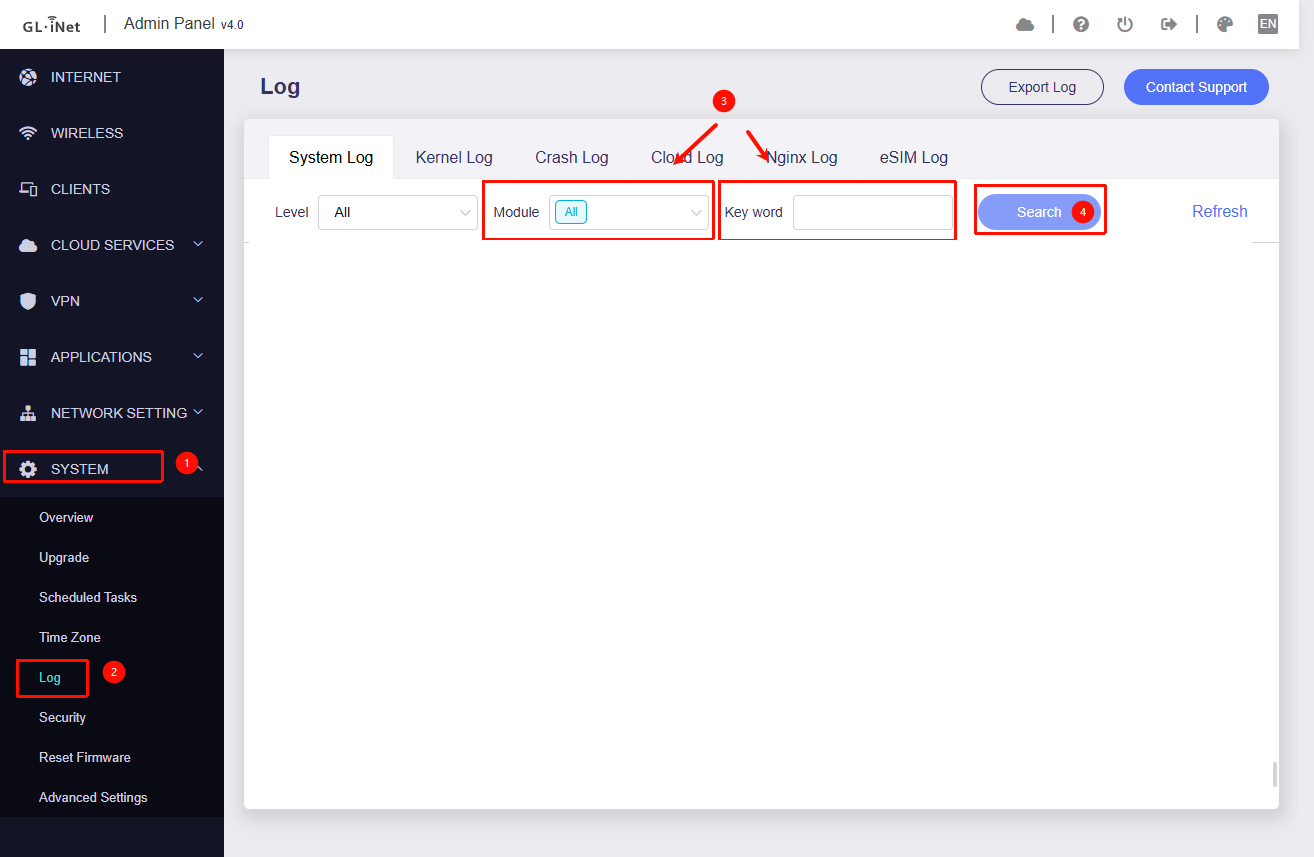
It’s great that the UI provides quick access to the full/raw logs for system, kernel, crash, etc. But this is overwhelming and not really helpful when wanting to quickly “check in” on how the router has been running.
If anyone knows where/how I can quickly access a simplified/summary list of device events that will be much appreciated!
If you are only concerned about specific events, you can use the keyword filter to narrow down the logs.
Below is a list of some keywords and the corresponding log entries:
SSH login attempts: dropbear
Thu Nov  6 20:35:43 2025 authpriv.info dropbear[17090]: Child connection from 192.168.8.201:21381
Thu Nov  6 20:35:43 2025 authpriv.notice dropbear[17090]: Password auth succeeded for 'root' from 192.168.8.201:21381
LuCI login attempts: luci
Thu Nov 6 20:39:29 2025 user.info : luci: accepted login on / for root from 192.168.8.201
GL Admin Panel login attempts, on Nginx Log: login
Device has booted / rebooted: Booting Linux on physical
[ 0.000000] Booting Linux on physical CPU 0x0000000000 [0x410fd034]
WAN x is up / down: netifd
Thu Nov  6 20:40:01 2025 daemon.notice netifd: Network device 'eth0' link is up
Thu Nov  6 20:40:01 2025 daemon.notice netifd: Interface 'wan' has link connectivity
Thu Nov  6 20:40:01 2025 daemon.notice netifd: Interface 'wan' is setting up now

Tue Feb  3 12:08:00 2026 daemon.notice netifd: Network device 'eth0' link is down
Tue Feb  3 12:08:00 2026 daemon.notice netifd: Interface 'wan' has link connectivity loss
Thank you for the quick and helpful reply Will. While this will be very useful for finding specific types of events of interest, having to input and search for different types of events individually, and then manually combine the results into a single chronological list, doesn’t really satisfy the efficient/quick requirement here.
Is it possible to search for multiple keywords at once (to have all events from all event types of interest listed at the same time)?
Do you know if it’s possible to achieve this using GoodCloud? Or should I ask this in that forum?
Basically looking for a quick and easy way to view a list of the important/useful system, security, and network-related events. The diagnostic-level events may be helpful for advanced troubleshooting, but it’s hindering regular status monitoring and basic troubleshooting efforts. Thanks again.
At the moment, we do not support viewing these as event on router.
If you need to list all occurrences of the activity types you’re interested in, you may need to SSH into the router and run the following command to output them: