Hi Friends, I started this project as I was beta testing the SlateAX and wanted better specs and what was happening.
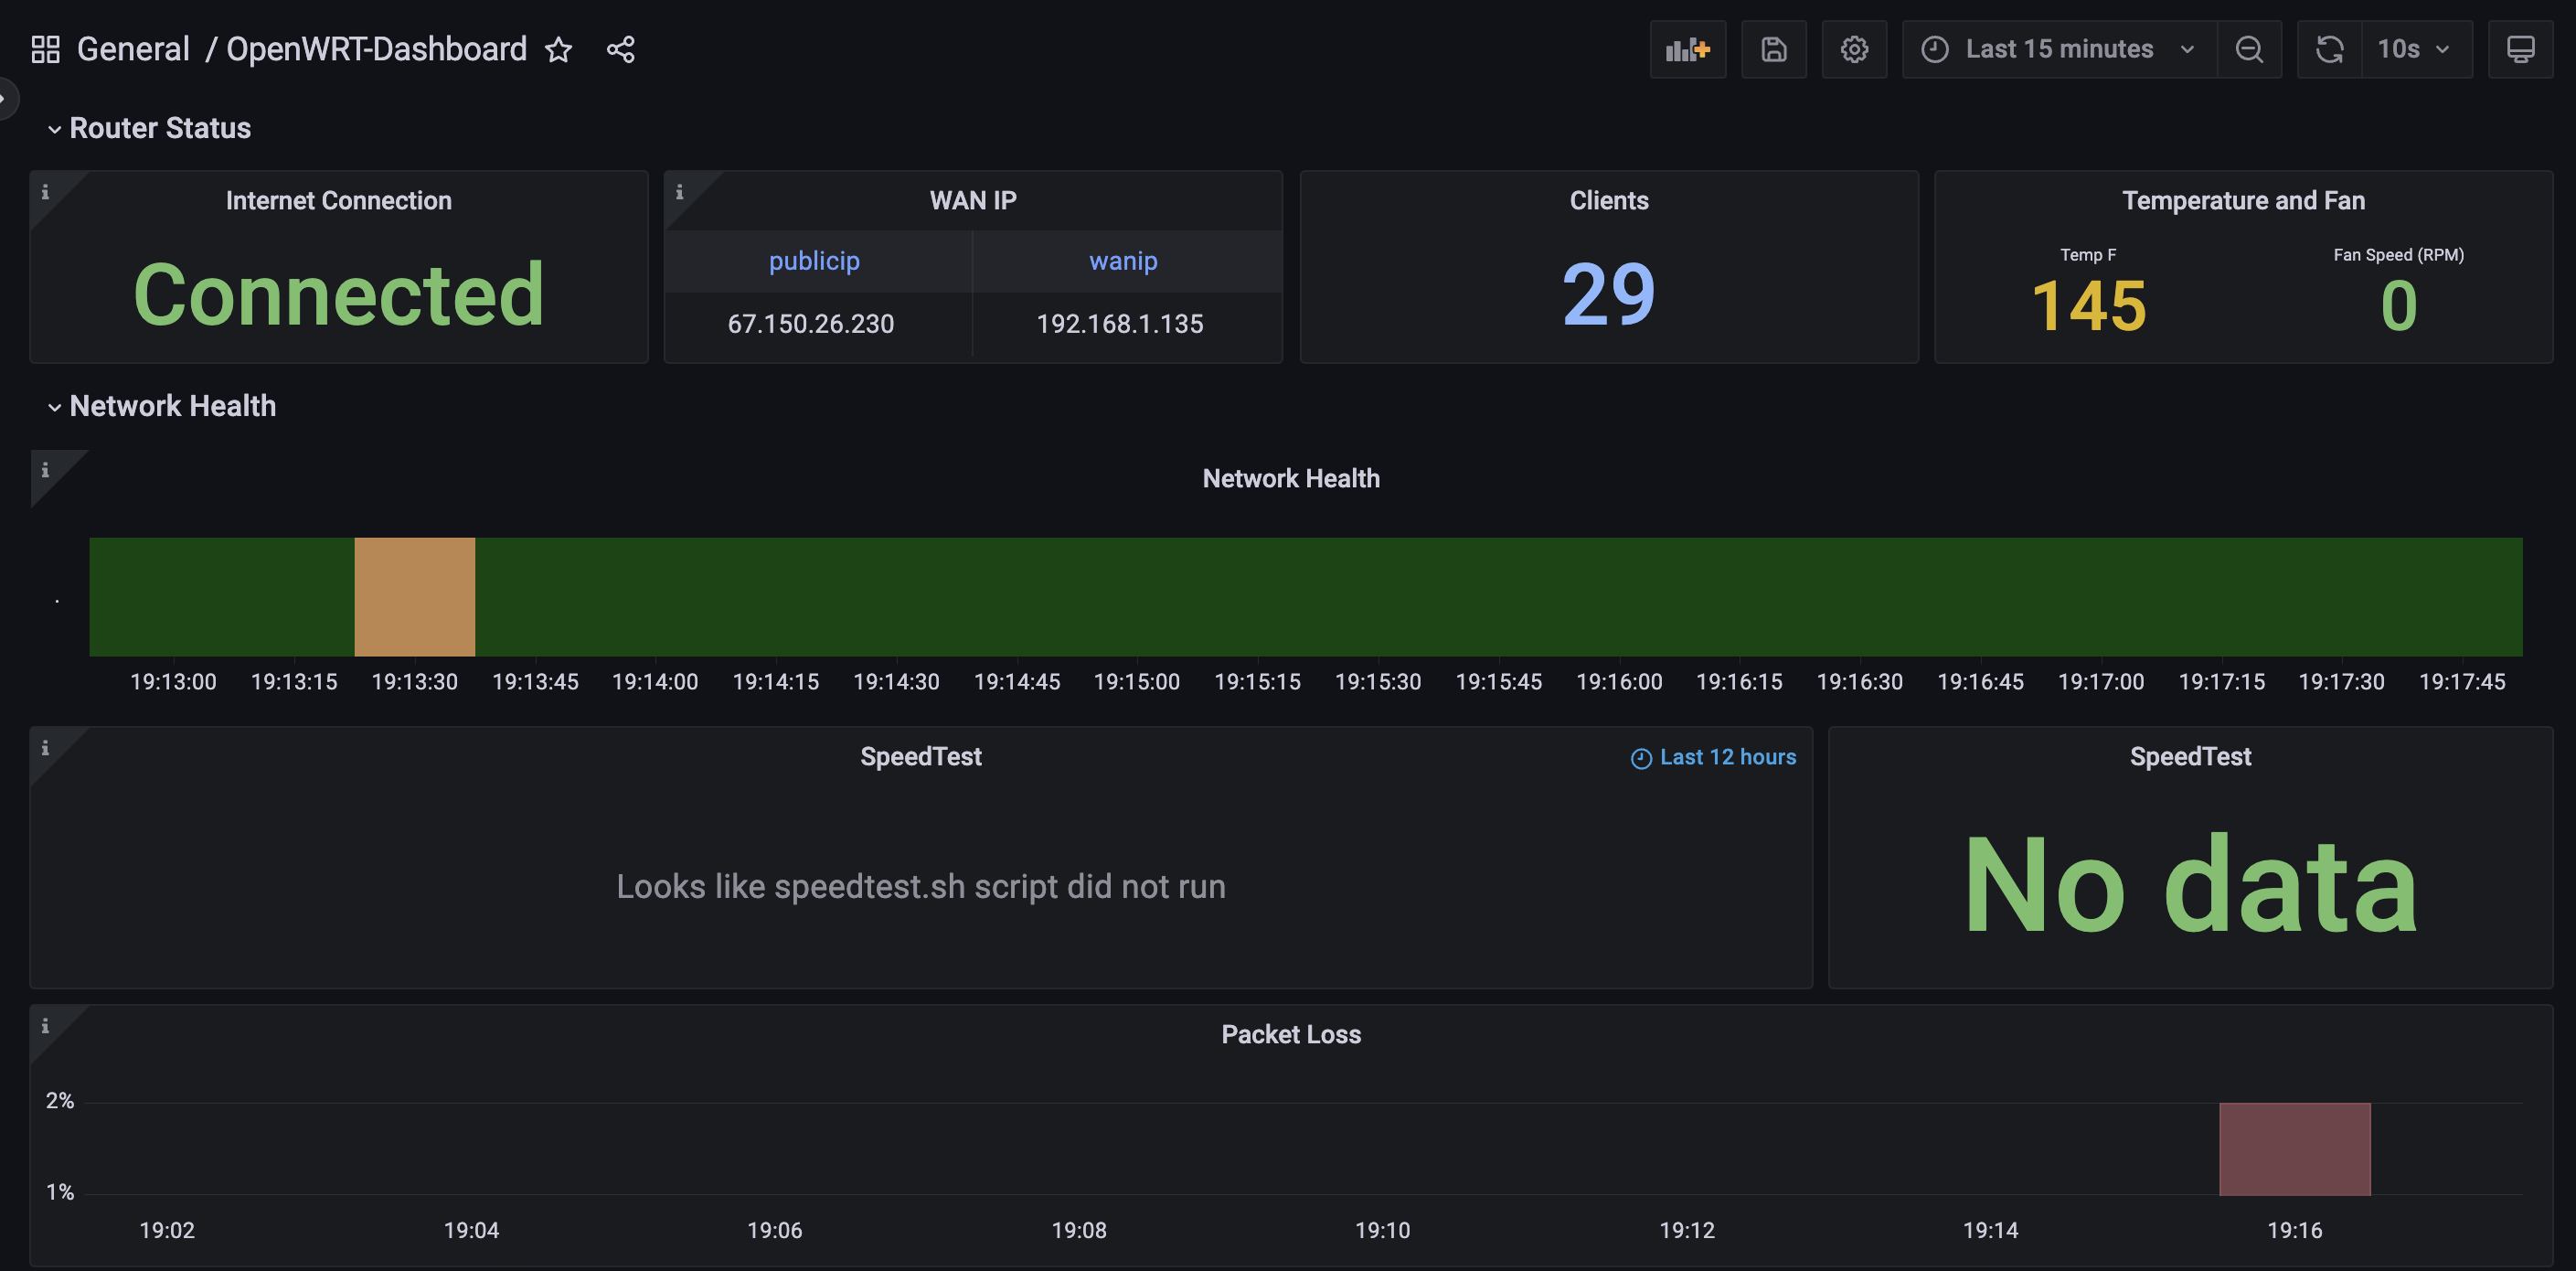
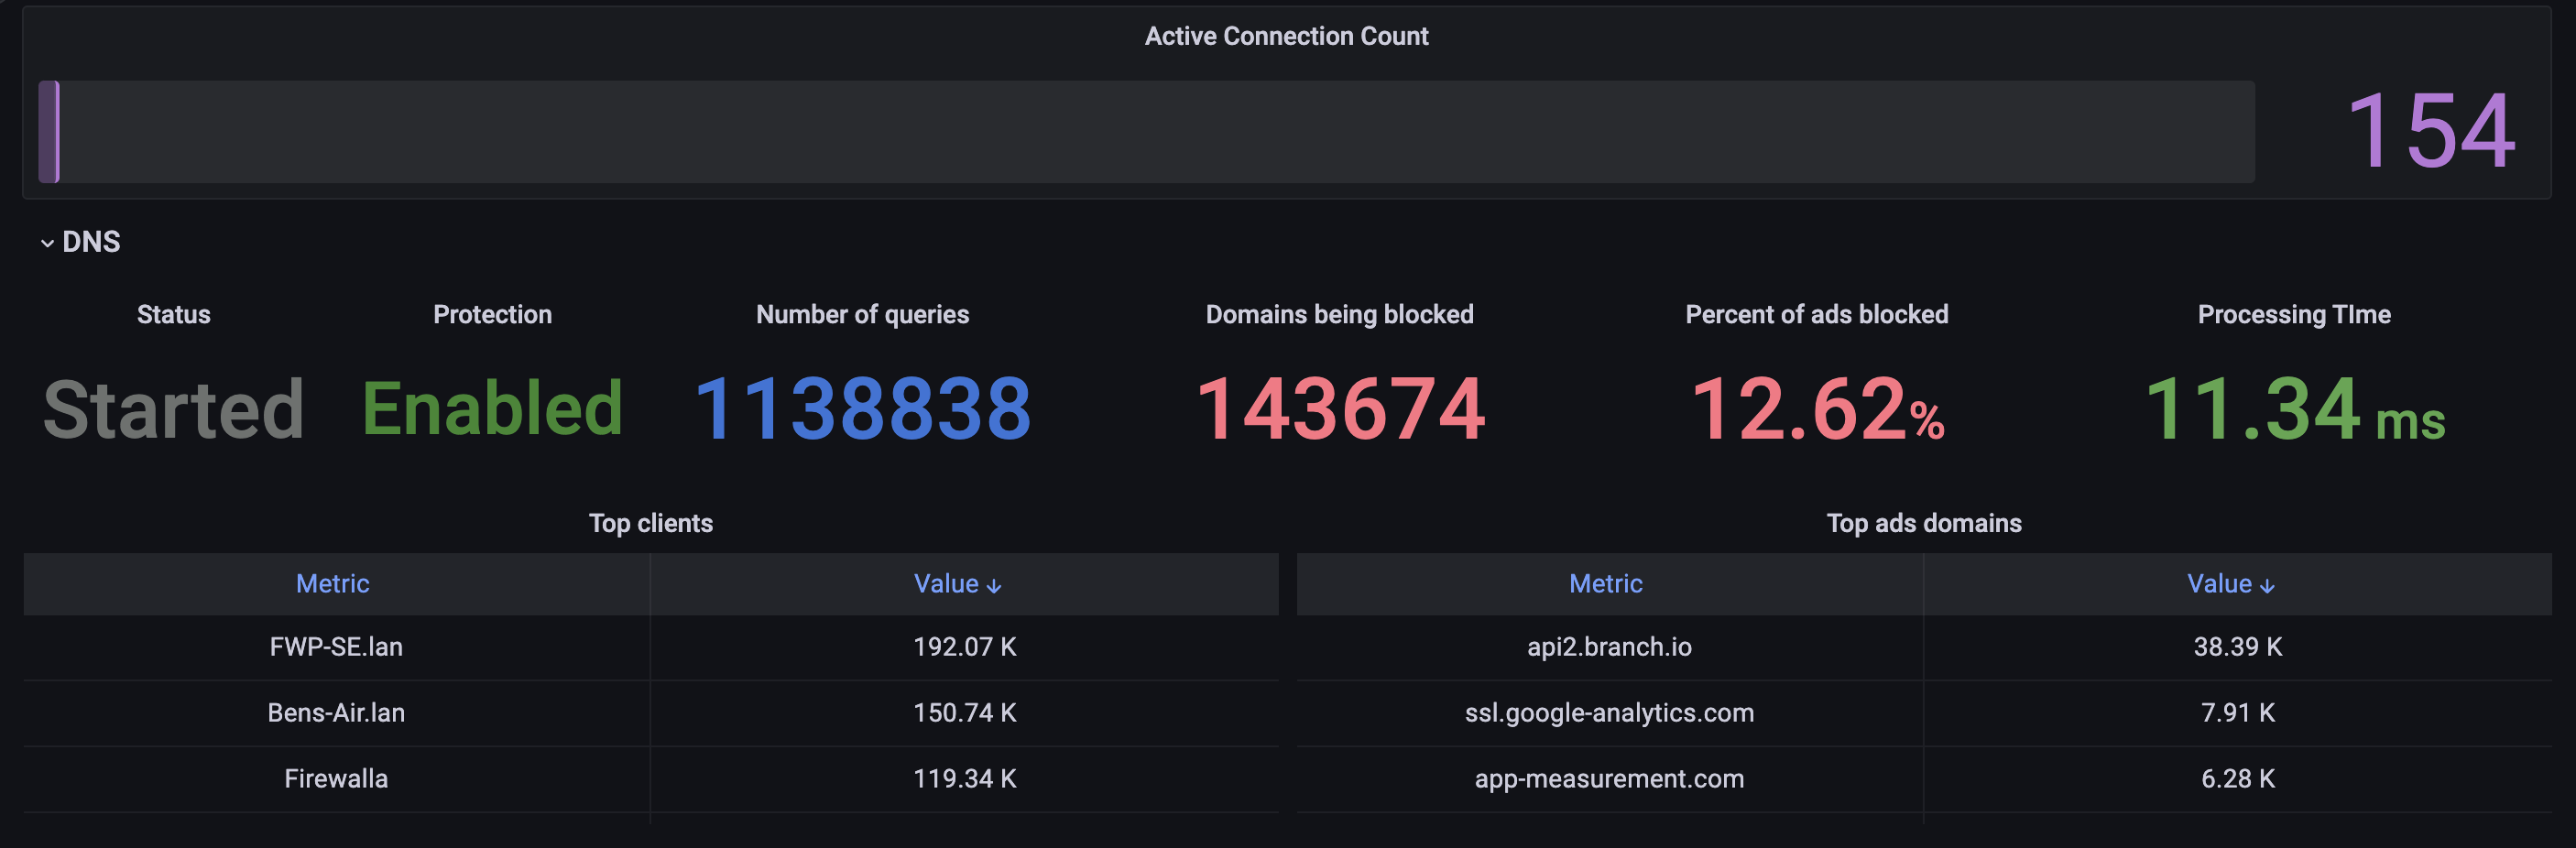
This will show you NAT traffic, live device traffic, bandwidth over 7 days, and some DNS stats, also speedtest.
I created this GitHub repo. You will need to install Prometheus/Collectd/IPTMON on your device and have a home server running Docker with Docker-Compose.
You can have a peek here:

4 Likes
Is supported to host the docker on web, like vps on digital ocean or vultr… I want to access grafana online…
Preferably on the same subnet as the router. Otherwise, you can set it up in a VPS, but you’ll have to connect your device via wireguard, and update the IPs for your docker host.
I have two VPSs in the cloud and I could tell you that Loki and Prometheus query quite a bit so it will saturate the connection very quickly and the experience won’t be nice.
1 Like
thanks for the reply… Last question, I have a brume2, can i install all the softwares on my brume2 alone?.. I dont have extra router to host the docker instance…ty
Sure thing. It’s possible with the amount of ram but it’s only a dual core, so you wan speed might take a small hit. But yes if the container has an arm image, it will work just fine load everything on the Brume2.
Actually, it needs to be x86 arch. The loki_enhance_middleware container isn’t arm compatible.
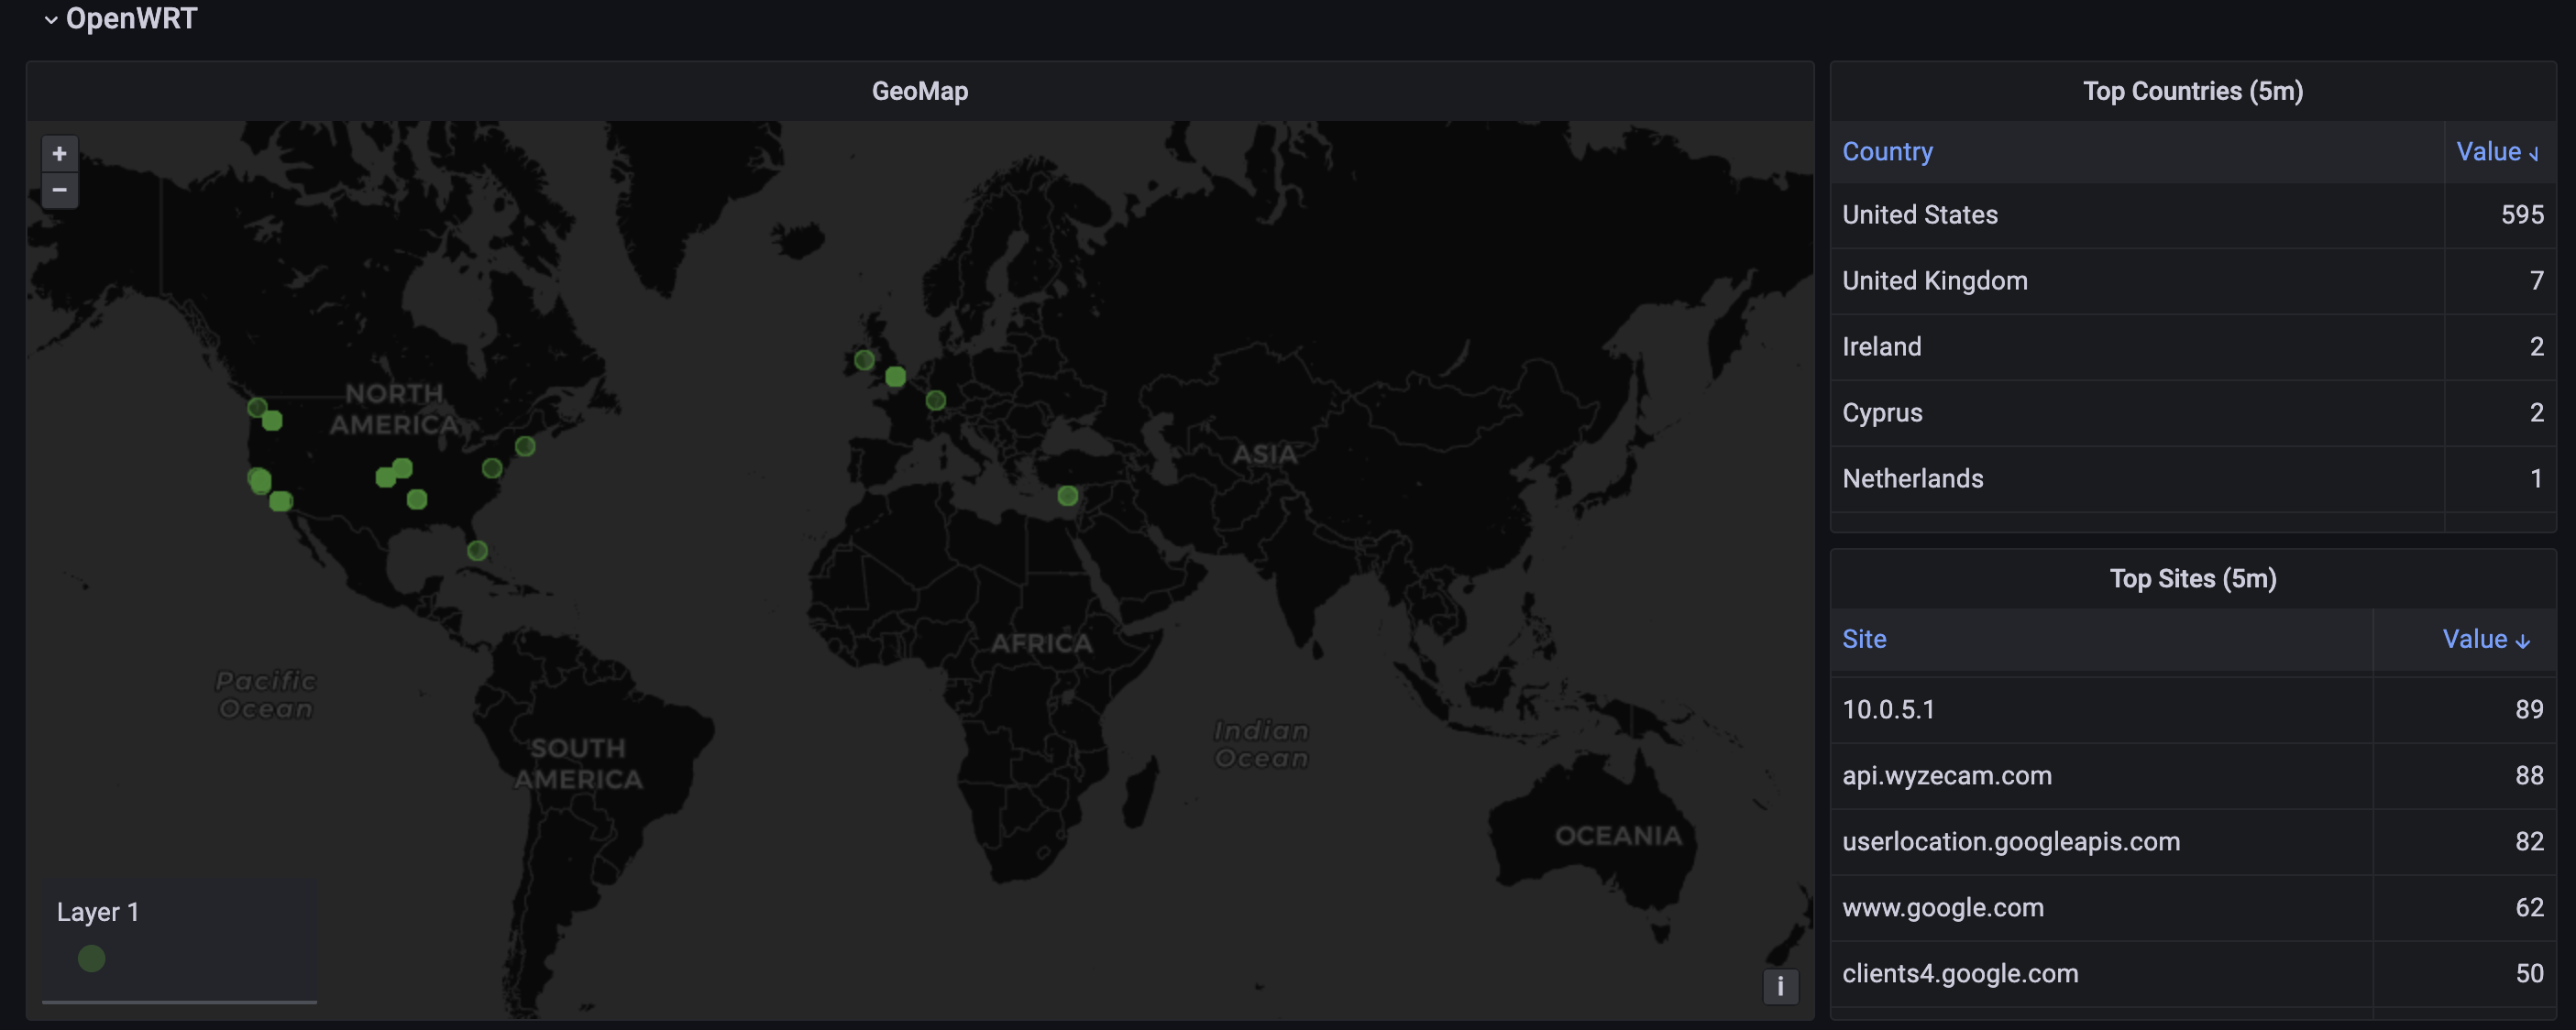
loki_enhance_middleware container will read the netify logs and add geoip to them.
1 Like