I’m sort of curious myself so I thought I would start a topic on VNStat, which keeps track of router statistics with what appears to be a light footprint. I started with my Mango.
With Luci installed, install vnstat, vnstati, and the luci-app-vnstat. I had no difficulty with my Mango, and it picked up both the WISP interface and the internal bridge interface. It generates tables and charts with daily, monthly and all-time traffic. This is the 1.18 version for 19.07. There is a 2.x version for the next go round that will use sqlite.
A downside is that the database is in temp space, so it disappears at each reboot. Follow the directions here: [OpenWrt Wiki] Network Traffic Monitor with vnStat to change the update interval to five minutes from the default one minute, start the daemon. Then follow Method 2 on that page to have a cron save the database to flash every six hours.
That seems to preserve the data on a reboot. I haven’t tried to see if the database is recovered to the last backup when you just unplug the router.
Things I haven’t figured out:
Adding a script using curl to email the stats daily. That’s something a script on my Asus does.
Adding a script that computes usage against a maximum bandwidth. Also something my Asus does.
In a script, recomputing usage from base 1024 (how VNStat computes usage) to base 1000 (how ISPs compute usage).
Maybe others want to tackle those.
Trying to get to here, the email I get each day from my Asus:
You have used 9.78% (488.88GB) of your 5000.00GB cycle allowance; the next cycle starts on day 1 of the month.
I am afraid that I know ‘not a lot’ of the scripting languages, or how to access OpenWrt using them, so will watch this thread with interest.
I do know Node-RED and have used REST API’s for that and other things. FYI Router I have is GL-X750V2 (Spitz)
I have a Node-RED flow that is able to access WAN signal strength and the available WiFi networks available, so I might be able to develop that further, but then I would need to be able to store the historic data. This is ‘doable’ as I have an RPI running on the Network already (PiHole).
I have installed VnStat and am running it to see what data is available.
Stuck at the moment with curl. Everytime I try to send an email with a configuration that works in other environments, I get a 48 error, suggesting a mismatch between curl and libcurl; maybe this version of curl isn’t compiled with SMTP.
Also, not sure where to find the nice pix vnstati creates to attach to the email.
EDIT: Ok, I’ve got this partially working with msmtp instead of curl.
@elorimer I am still looking, but came across this thread on OpenWrt. Don’t know if that will help at all.
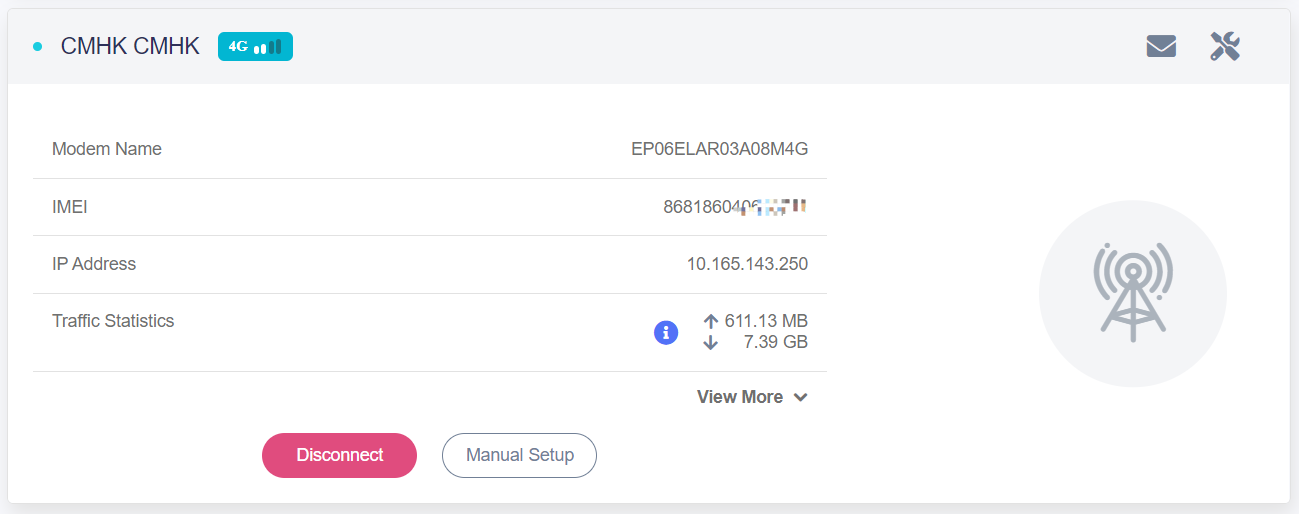
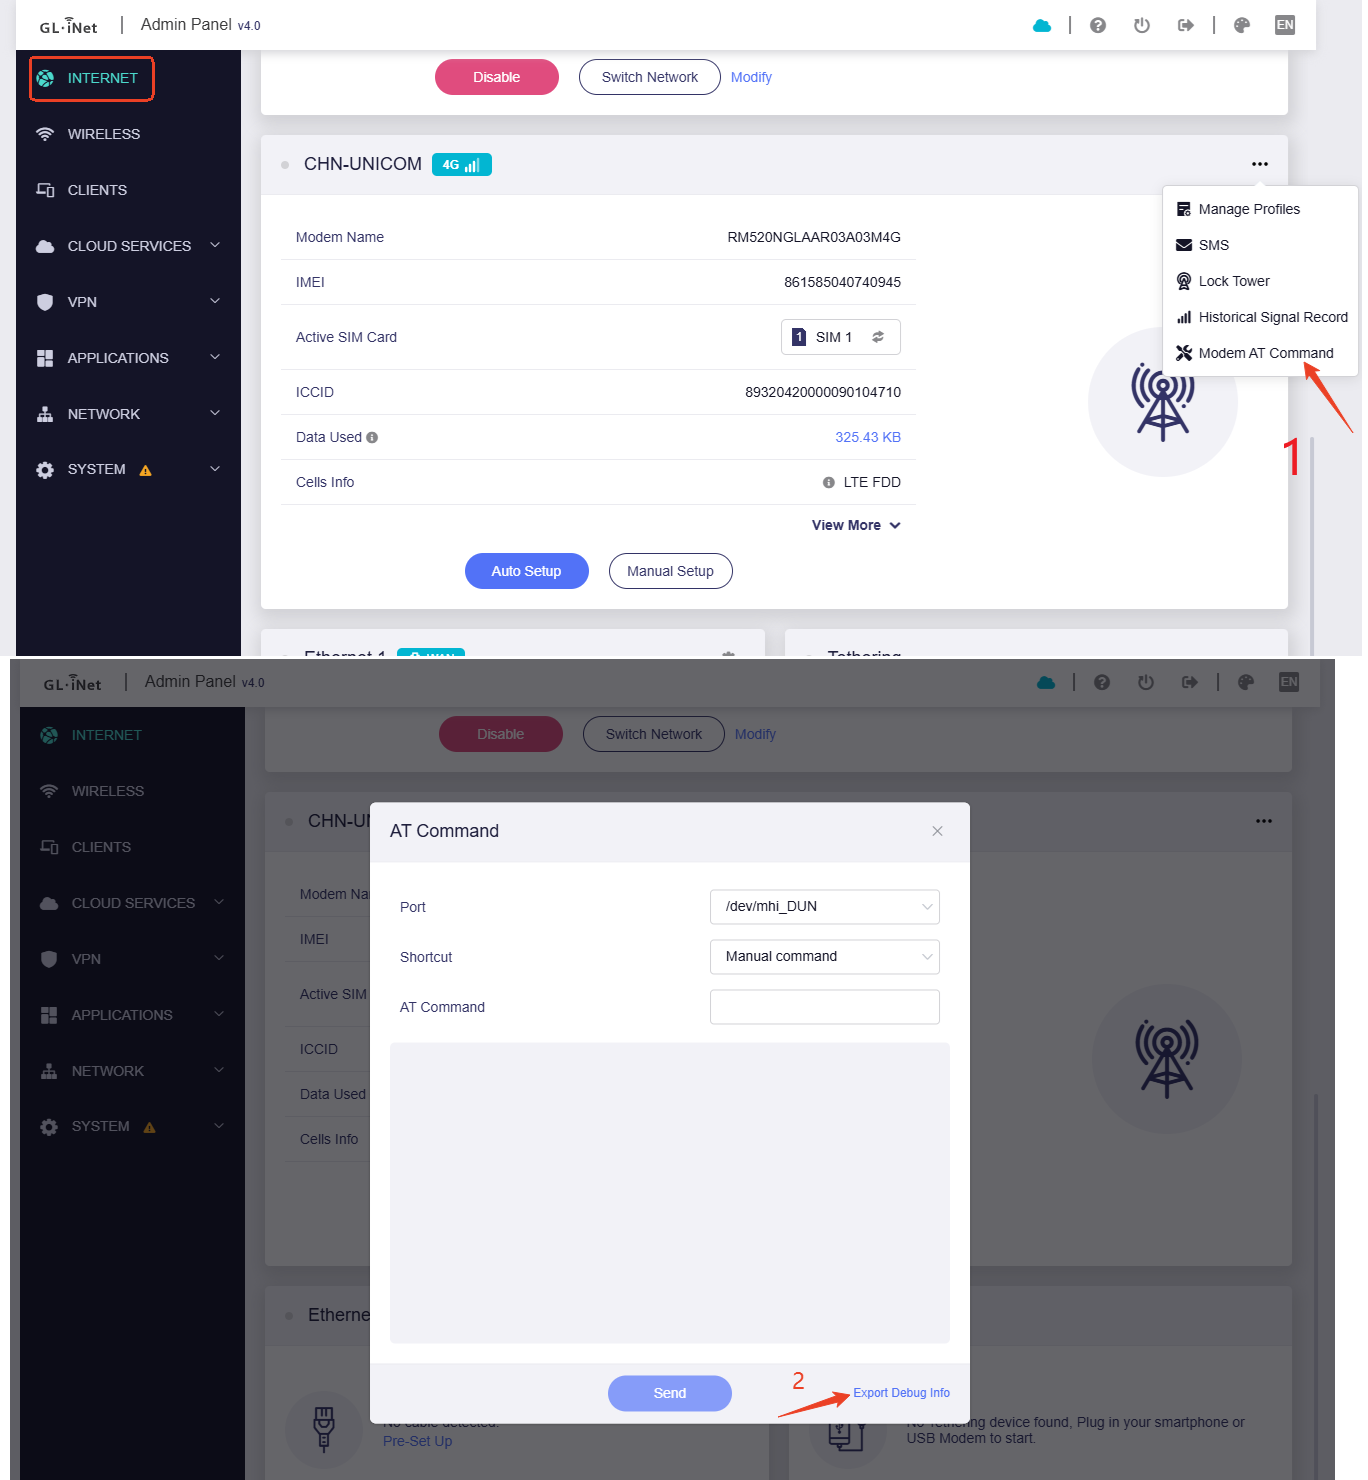
@alzhao Is it possible to get the Upload and Download figures from the Modem connection status box on the Internet page of GL.iNet Admin added to the GL.iNet REST API? Or give a clue as to where they are obtained from? Thank you.
You mentioned API v4.x in a previous thread from October and I understand that you will not be developing API v3 any longer. Have you any idea when v4.x might be available to use?
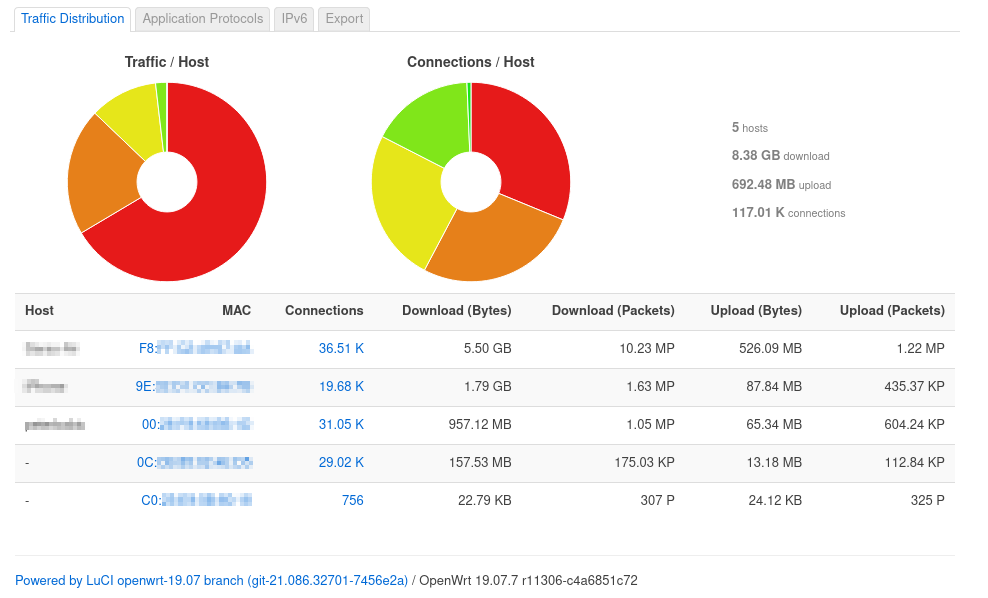
I’ve made some progress with this but I’m puzzled over the interfaces I want to monitor. I’m thinking I really only want stats from my WAN connection, whether that is tethered over a 3G/4G phone or wired to the WAN port or with a WISP connection to my home wifi. At the moment I’m only using the WISP function.
From the parentheticals I thought I should be looking at apcli0 and / or eth0.2, but after several days there is zero traffic on apcli0, and only transmitted traffic on eth0.2. I’m guessing apcli0 may be solely for USB tethering, so that is okay, but I thought I should see much more received traffic.
On ra0 I have a lot of received/transmitted traffic.
Unfortunately, my Router is used in the Motorhome and we are now at home for a while. I did manage to start getting stats, but have yet to understand how they all relate to each other. I do have a Router here with OpenWrt installed, I will have a go with that, but is is only used as a wifi extender.
Older thread, sorry, but I just installed all the referenced packages using the vnstat2 version on my Flint 2 because I almost ranched my ISP's bandwidth limit last month because of the Olympics on Peacock. I was streaming multiple Olympic games that were a couple of hours long at the same time and the hours of all the Olympic golf matches. That's why I was looking for something like this so I can monitor my internet usage.
I'm thinking that something like this should be part of the native GL.iNet firmware besides just the Realtime Graphs.
Just before I dig into this, will this enable me to have a timeline of the UP/DOWN status of my GL.iNET router ? Because I have frequent "router down" issues. I notice it because of the message in the router interface, however I would like to have some summary of the stability of the connection.
Not that the router is down, more that my connectivity through cellular is quite flaky, seems to disconnect frequently and reconnect automatically after 30 seconds, so I lose my connection during those time intervals.
I would like to track those periods (duration, number of occurences, time when it happened), was wondering if VNstat would be able to provide me historical information of when my network is down (not the router, the network).
I heard that there is a VNStat2 as well, has VNStat been supersed by VNStat2 ? In this case, is there a guide for VNStat2, or do I just add a "2" after vnstat ?
Forgot all about this. As I mentioned in the first post vnstat2 is an updated version that uses sqlite and a single database, and adds some additional functions. For an updated kernel, too. I installed it on my Beryl AX and I will fool with it a bit when I have time.
I don't thing it is going to give ppgt what he is looking for though--it just records the amount of traffic on the interfaces, not whether they go up or down.
EDIT: Also, with either package, I think you have to go through the steps I pointed to in the first post three years ago to backup/restore the database in non-volatile space so it survives a reboot.