I have a GL-X3000. I use it with a 5G SIM card, and I have 37 wireless IoT devices connected on its 2.4GHz Wi-Fi. The only enabled application on it is AdGuard Home. No VPN server, no VPN client, no storage, no parental controls, no dynamic DNS, no tailscale, nothing. Just AdGuard.
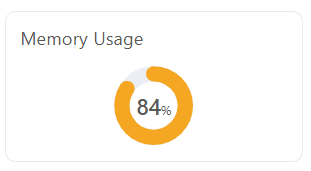
That prevents me from enabling additional applications on the router. Even now, after enabling AdGuard, more often than not the whole network becomes slow and the issue is resolved after I restart the router. Before enabling AdGuard the memory usage was 75%. Which is still too high for a router running in a factory default state.
Is there anything that can be done to reduce memory usage?
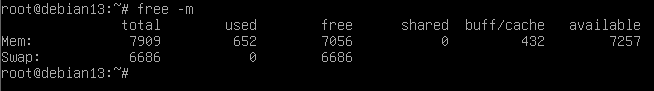
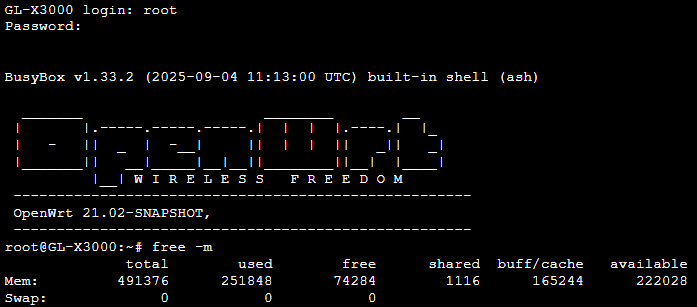
First of all, Linux itself will actively use running memory to maintain efficient system operation:
In addition, as you enabled ADG, the memory usage of this plugin is large, and if you enable a lot of filter, will take more memory.
Please reduce the filter enabled, or custom add this filter, it already meets most daily needs: HaGeZi Multi PRO++ mini.
I understand what you’re saying, but if that were the case then all Linux computers would boot for the first time using 75% (or more) of their RAM. And that’s just not true.
AdGuard was enabled, and it’s using it’s default settings. The settings that GL-Inet decided it should use. I didn’t modify any of the filters.
And I don’t have a problem with a 10% increase in memory usage after AdGuard installation. The actual problem is the GL-X3000 75% memory usage from the factory.
Buffer/Cache is not free memory though. It can be reclaimed, but it is in fact used memory. Perhaps they should instead show the breakdown itself? Otherwise, 85% is accurate imo.
I’m not convinced this isn’t an actual problem, I use Speedify w/ Tailscale and either there’s a memory leak with Tailscale, this router doesn’t have enough ram or the firmware’s running bloated…
Theres a 50/50 chance one of these crashes due to consuming too much memory.
Is Speedify a self-installed plugin?
Yes, you can check more info on the software on their website. It consumes about the same amount of memory as Tailscale. I wish these routers had 1GB or were upgradable.
According to your description, it does seem to take up a lot of memory.
But it shouldn’t cause to crash.
There is still a log if the crash and even restart. Please share the logread.tar with me.
BTW, is the ADG enabled?
And you can check the memory usage through opkg update && opkg install htop && htop.